Sales
Stay on your successful sales course
See your sales pipeline on a single screen. Track revenues in real time. Be consistent towards your sales strategy. Empower your executives to see their progress, sales performance and goals. Detect deficits with data analysis ahead of time. Dig deeper into your customer data and draw better conclusions.
How can our Power BI Sales dashboard benefit you?
mPower BI dashboard for Sales is configured with Sales department KPIs that are widely tracked to see the sales pipeline across all sales channels.
Sales Overview
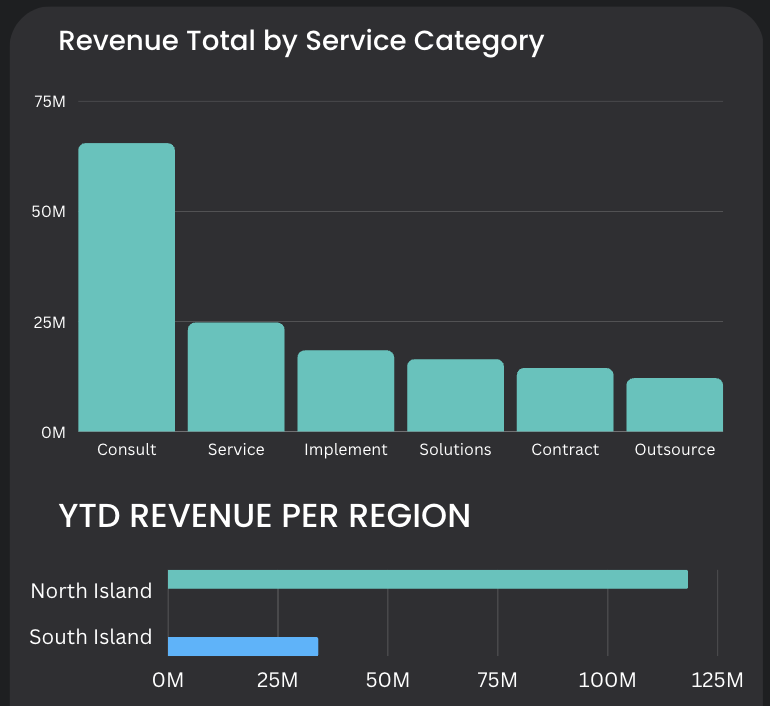
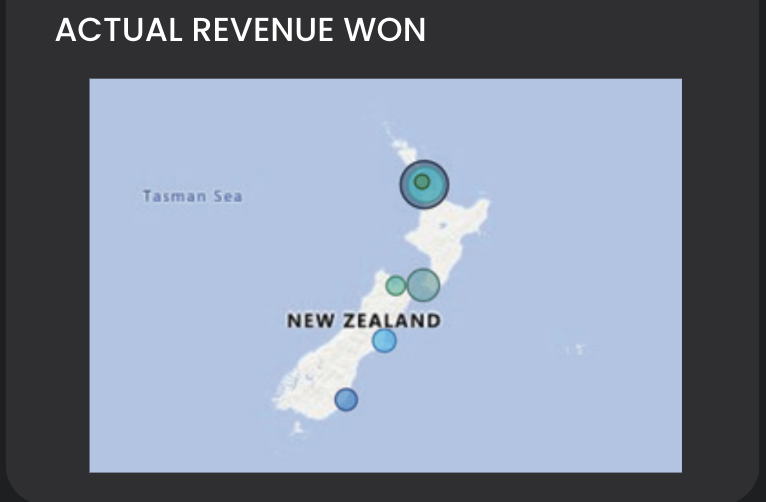
Total Active Clients, Total Revenue, % of Total Revenue, Sales won, Sales Lost, Opportunities Open, Revenue by Client Group/Category/City, YTD Revenue
Sales Revenue Insights
Total Sales, Previous Highest Sales and Rolling Average Sales, Total Profit, Profit Margin, Territory/Channel/Product based filters, Top 5 Customers, Top 5 Territory


